.jpeg)

How to Post a YouTube Video on Facebook: 2026 Guide
Learn how to post a YouTube video on Facebook in a few simple steps. Follow these methods to share videos easily and boost your social media engagement in 2026.
5 min read
September 26, 2026

Learn how to measure and grow content marketing ROI with practical steps and real examples. Improve your strategy and track results in 2026.
Written by:


A well-established content marketing benchmark says it generates 3x more leads than outbound marketing while costing 62% less. That makes content look like an easy investment decision, but proving its return requires more than dividing revenue by a publishing budget.
The surprising part is that content marketing ROI usually fails in the reporting layer, not in the arithmetic. A blog post may introduce a buyer, a video may build trust, an email may bring the buyer back, and a sales conversation may close the deal weeks later. If your dashboard credits only the final click, the content appears unproductive even when it helped create demand.
That gap matters in 2026, as search and discovery continue to change. Content teams must measure more than visits and last-click conversions. They need a practical view of pipeline influence, lead quality, customer journeys, and the efficiency of turning one asset into many useful touchpoints.
Content can produce strong acquisition economics, but the return rarely appears in one reporting field. The long-running Demand Metric benchmark reports that content marketing produces 3x more leads than outbound marketing at 62% lower cost. The benchmark and its business context are summarized in this overview of content marketing statistics.
The operating model is straightforward: one asset can attract searchers, educate prospects, support sales conversations, and supply material for social distribution. That makes content a potential acquisition channel, not only a branding expense. The commercial question is whether those activities create or accelerate opportunities at a cost the business can support.
Finance usually exposes the measurement problem quickly.
A marketing manager may associate an opportunity with an article, while the buyer recalls a webinar. Analytics may show branded search before the demo request, and the CRM may record an email click as the conversion source. Each system captures a real interaction, yet none represents the complete buying path.
The equation is easy. The decisions behind it are harder: what counts as a return, which costs belong in the investment, and how much credit each content interaction deserves.
Content also produces value on different schedules. A product comparison page may assist a buyer quickly, while an evergreen guide builds visibility over time. A video can shape a decision without generating a trackable website session. AI-generated answers and zero-click search create another measurement gap because prospects may encounter your ideas without visiting your domain.
The 2025 B2B benchmark research from the Content Marketing Institute shows the scale of the problem. 56% of marketers struggle to attribute ROI to content, and the same percentage struggle to track customer journeys. 44% can't tie performance to business goals, while 37% cite data silos.
Practical rule: Do not wait for perfect attribution. Use a consistent model that separates direct revenue, assisted pipeline, and leading indicators, then refine it as the underlying data improves.
Budget decisions should connect content activity with business outcomes instead of rewarding whichever channel captures the final click. A resource allocation framework for comparing content investments can help teams weigh production effort, distribution capacity, reuse opportunities, and likely commercial value.
Repurposing strengthens that calculation. A single video, for example, can support clips, articles, emails, and sales assets, giving one production cost more opportunities to influence demand.
The better question is, “Where did this content create, accelerate, or strengthen a revenue opportunity, and was that contribution worth the total cost?”
Content marketing ROI becomes useful when the formula reflects the true economics of producing and distributing content:
Content marketing ROI = (content-attributed return minus content investment) ÷ content investment × 100
Use gross revenue for a straightforward campaign comparison. Use gross profit for budget decisions when margin data is available. Revenue can make a low-margin sale appear more valuable than it is, while profit shows whether the content generated economic value after delivery costs.
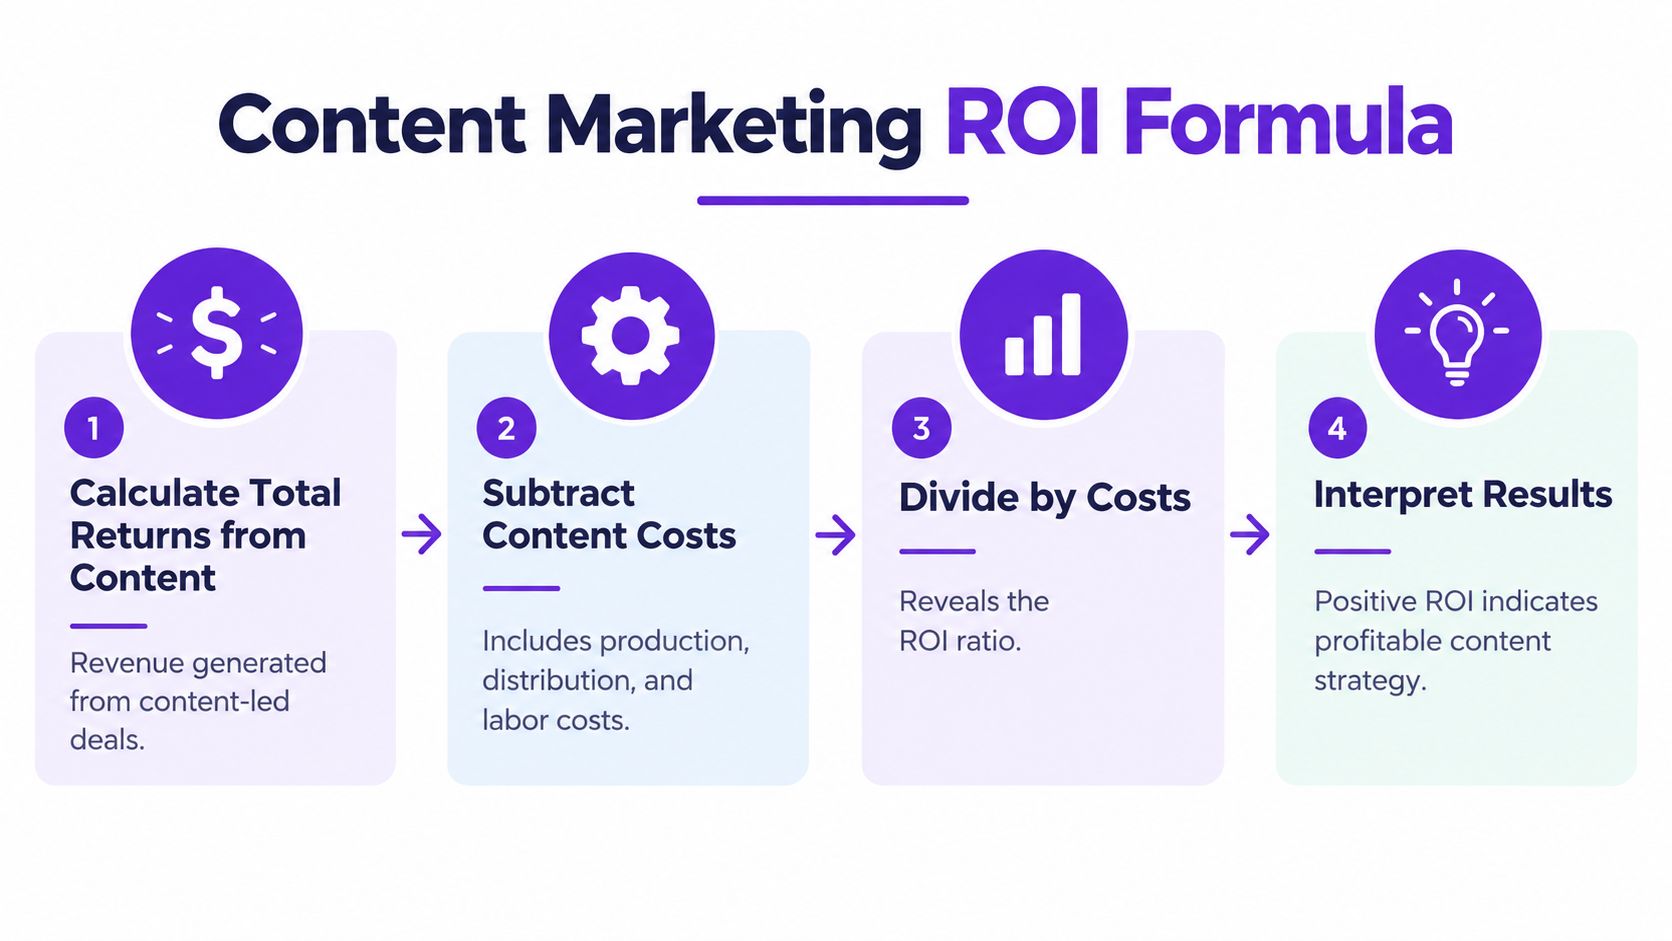
Count every cost created by the program:
Suppose a campaign costs $10,000 and generates $27,700 in content-attributed gross revenue:
($27,700 − $10,000) ÷ $10,000 × 100 = 177% ROI
That result equals $2.77 for every $1 spent, a historical benchmark cited in Forbes Advisor's content marketing statistics. It provides context, not a target. Sales-cycle length, margins, distribution quality, and attribution rules can materially change the result.
The same source reports a newer compilation reaching $7.65 per $1 spent, depending on methodology and channel mix. The gap between those figures is a measurement warning. Blended benchmarks may combine channels with different costs, time horizons, and definitions of return, so use them to frame questions rather than set forecasts.
Repurposing also changes the cost base. If one video becomes clips, articles, emails, and sales assets, the original production cost supports more opportunities to create or influence revenue. Measure those assets under a documented allocation rule instead of treating each derivative as a new full-cost production.
Apply the same rules in every reporting period:
The formula will not eliminate attribution gaps. It will expose them, giving the team a consistent basis for improving measurement and budget decisions.
Watch the accompanying walkthrough for a visual explanation of the mechanics.
ROI benchmarks become useful only after they are calibrated to the business model. A B2B software company with a long buying process cannot assess content like a local service provider that depends on phone enquiries. The formula remains consistent, but the conversion path, time to revenue, and acceptable investment differ.
Published estimates span a wide range. Earlier content marketing benchmarks cited $2.77 returned per $1 spent, while newer compilations report figures as high as $7.65 per $1, depending on methodology and channel mix. Treat those figures as prompts for better questions, not as targets to copy. As noted earlier, the measurement method can make content appear more or less productive than it is.
| Business Model | Typical ROI Range | Key Driver |
|---|---|---|
| B2B SaaS | Positive return often develops over time | Search visibility, education, product evaluation, and pipeline influence |
| Professional services | Positive return depends on qualified demand | Expertise, trust, referrals, and sales conversations |
| E-commerce | Positive return can appear closer to conversion | Product discovery, comparison content, email, and repeat purchase |
| Local services | Positive return is tied to actionable enquiries | Local intent, proof, reviews, and clear contact paths |
| Creator or education business | Positive return depends on audience monetization | Search discovery, video engagement, email nurture, and offers |
The table avoids false precision. A universal “good” content marketing ROI does not exist. A high-value B2B purchase may justify months of educational content before a buyer submits a form. A local provider may need fewer interactions, while each missed enquiry affects revenue sooner.
Repurposing changes the economics as well. One research-heavy asset can support search pages, email, sales enablement, and social distribution. The return depends on whether those formats reach different buying moments without creating disproportionate editing and distribution costs. Taja AI can support that workflow, but the resulting assets still need separate performance checks.
Channel metrics require the same context. Click-through rate shows whether a message earns attention, not whether the audience is qualified or commercially valuable. Use this guide to what makes a good CTR to diagnose engagement before connecting it to revenue.
Start with one customer's economics. Estimate gross profit per customer, acceptable acquisition cost, sales-cycle length, and the share of pipeline content should influence. Then select leading indicators that match each asset's job.
An awareness video may be assessed through qualified reach and assisted visits. A comparison page should be judged by evaluation activity and opportunities. A sales enablement article may attract modest traffic yet influence late-stage deals. Report those outcomes separately rather than forcing every asset into the same conversion target.
Industry benchmarks are reference points, not operating targets. Your own cohort data should become more important as tracking matures.
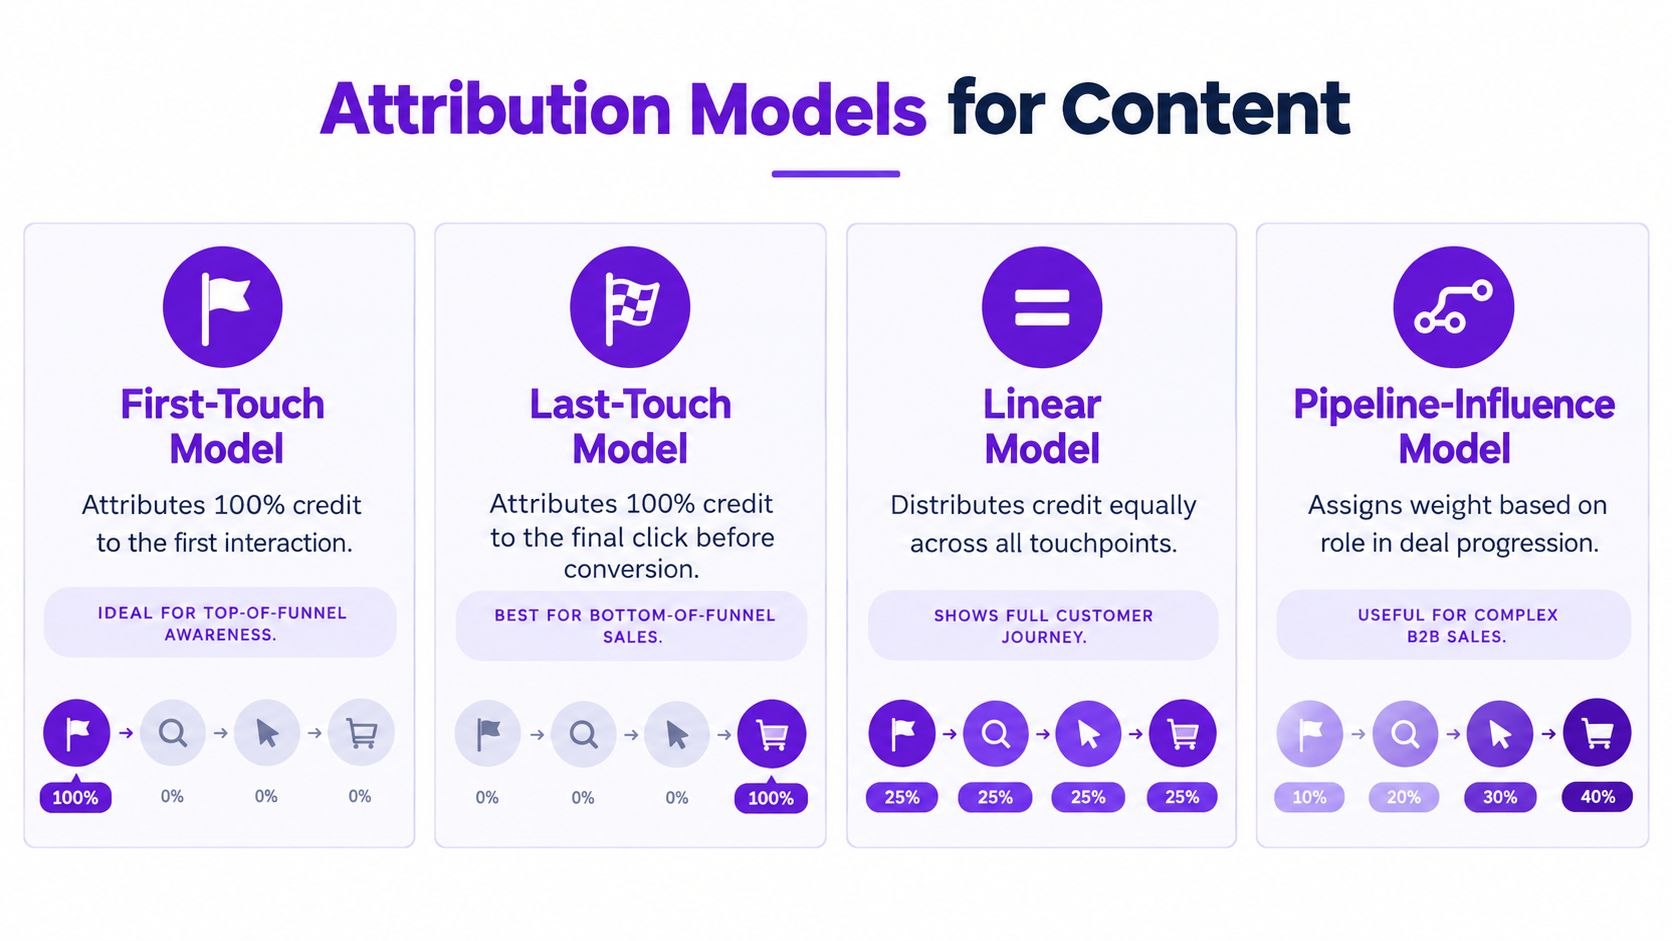
Attribution assigns credit according to a chosen rule. It does not reveal a single objective answer. Each model supports a different decision, so the right choice depends on whether the team is assessing awareness, conversion, or pipeline progression.
First-touch attribution identifies the content that introduced a buyer. It helps demand-generation teams evaluate awareness sources, while giving no credit to the assets that later shape evaluation or create an opportunity.
Last-touch attribution records the interaction immediately before conversion. Its simplicity supports bottom-of-funnel decisions, but it can overvalue a retargeting click or branded search and overlook the earlier content that built preference.
Linear attribution spreads credit across recorded touchpoints. It makes assisted influence visible, yet treats a brief interaction and a decisive comparison page as equally important.
Pipeline-influence attribution links content activity to opportunity stages. For complex B2B sales, this is often the most useful operating view because it asks whether an asset helped create or advance a qualified opportunity, rather than counting clicks alone.
| Model | Best question | Main strength | Main blind spot |
|---|---|---|---|
| First touch | What created awareness? | Useful for acquisition planning | Ignores later influence |
| Last touch | What completed the conversion? | Simple and actionable | Undervalues demand creation |
| Linear | Which interactions appeared in the journey? | Makes assisted influence visible | Assumes equal importance |
| Pipeline influence | Did content affect opportunity progress? | Aligns with complex B2B revenue | Requires stronger CRM discipline |
A small team can start without an enterprise attribution platform. Connect analytics, forms, email activity, and CRM opportunity stages. Apply consistent campaign naming and record the content linked to each interaction. Review converted and unconverted journeys, otherwise optimization will favor only people who completed a form.
The 2025 B2B benchmark cited earlier reports that 56% of marketers struggle to attribute content ROI and 56% struggle to track customer journeys. That measurement gap makes a documented multi-touch model more useful than an elaborate model that marketing and sales cannot verify.
For teams improving the handoff from education to demand capture, this practical guide on how to turn content into customers provides conversion context.
A useful reporting view places directly sourced revenue, assisted pipeline, qualified engagement, and total program cost side by side. Keep these measures separate. Their differences show where content influenced revenue, which conclusions have strong support, and where tracking still limits confidence. Repurposed assets should retain their own identifiers, so one original idea can be evaluated across formats without assigning every downstream result to a single touchpoint.
The fastest way to improve content economics isn't always to publish more. It's to extract more useful distribution from the assets you already paid to create.
Repurposing is especially powerful for lean teams. One long-form interview can become a full video, short clips, captions, a newsletter, a search-focused article, sales snippets, and social posts. Each output serves a different intent, but the research, recording, and core idea come from one production event.

A repurposing workflow should preserve the original idea while adapting the format. Don't paste a transcript into every channel. Extract a strong claim for a short video, a practical sequence for a carousel, a question for an email, and a detailed answer for an SEO page.
The operating sequence is straightforward:
Taja AI can turn a long-form video into shorts, clips, captions, thumbnails, blog content, and platform-specific posts, which makes it one option for teams formalizing this workflow. Its relevance here is operational: the team can reduce repetitive formatting work and spend more time on editorial judgment, distribution, and measurement.
Repurposing a weak idea only spreads a weak idea faster. Start with a real customer question, a clear point of view, and evidence that supports the answer. Then optimize the primary asset for search intent, internal linking, conversion paths, and readability.
Distribution discipline matters just as much. Assign an owner, schedule the outputs, and record where each derivative appears. If a video produces clips but none of those clips lead toward a relevant next step, reach may increase without improving content marketing ROI.
The best workflow is not “publish everywhere.” It's one useful idea, adapted for several buyer contexts, connected to measurable business actions.
Consider a small B2B consultancy with a limited production budget. The team recorded one long-form expert conversation about a recurring customer problem. Instead of publishing the recording once and moving on, they treated it as a source asset.
The editor created a polished full-length video. The strategist then identified several independent answers inside the conversation, each with its own hook and audience question. Those answers became short clips. The team also produced captions, a written article, an email edition, sales follow-up material, and posts adapted to professional and social channels.
The important change wasn't the number of files. It was the number of useful entry points created from the same underlying research.
The full video supported buyers who wanted depth. Short clips introduced the topic to people who weren't ready to watch a complete interview. The article captured a more deliberate search journey, while the email version reached existing subscribers who already understood the consultancy's work.
Sales received a concise version they could share after discovery calls. That gave the commercial team a relevant educational asset instead of another generic brochure.
A documented content repurposing workflow helps teams make this repeatable. The workflow should specify the source asset, derivative formats, owners, publication destinations, links, and reporting fields.
Don't claim that every downstream action came from the original video. Use a controlled reporting approach:
The commercial lesson is practical. Repurposing doesn't guarantee revenue, and it shouldn't be reported as guaranteed revenue. It gives a small team more chances to be discovered, understood, and remembered without repeating the entire production process for every channel.
Taja AI helps teams convert long-form video into reusable shorts, clips, captions, thumbnails, blogs, and platform-specific posts, supporting a more efficient content marketing ROI workflow. Visit Taja AI to start turning one source asset into a measured distribution system.


We are blessed to work with leading brands & Companies


We try to make easy and simple for every professionals. Get 30 days free trial - No credit card required.


© 2025 Taja AI. All rights reserved.