YouTube Studio Deep Dive 2025: Turn Analytics Into Explosive Channel Growth
Stop treating YouTube Studio like a confusing report card and start using it as your channel's GPS. This guide shows you how to decode metrics like CTR, retention graphs, and traffic sources, then translate those insights into actionable strategies that drive real business growth. Because data without action is just noise, and you've got better things to do than stare at graphs all day.
Stop Guessing, Start Growing: Translating YouTube Studio Data into a Winning Strategy
You know that feeling when you log into YouTube Studio and get hit with a wall of graphs, percentages, and metrics that might as well be written in ancient Greek?
Yeah, you're not alone.
That overwhelming feeling when you first open YouTube Studio is universal, but understanding these metrics is the key to transforming confusion into strategic growth.
Here's the thing. 63% of full-time creators experienced burnout in the last 12 months, with nearly half citing content fatigue and the pressure to post everywhere as major stress factors. And while those numbers don't directly scream "analytics overload," dig a little deeper and the pattern emerges. Managing data, interpreting metrics, and trying to figure out what actually moves the needle contributes to that exhaustion in ways most creators don't even realize.
But here's what nobody talks about: only 12% of marketers use AI to analyze their data and performance. Think about that for a second. We're drowning in analytics dashboards, yet barely anyone's actually using them to make decisions. Most of us collect the data, glance at it, maybe feel good (or terrible) about the numbers, and then… do nothing different.
That stops today.
This article isn't another generic "YouTube analytics 101" guide. We're going deeper. Way deeper. Because if you're a busy creator, solopreneur, or small business owner trying to turn your YouTube channel into actual revenue, you can't afford to treat YouTube Studio like a passive scoreboard. You need a roadmap that connects those confusing metrics directly to business outcomes like more reach, better lead generation, and stronger brand authority.
Look, the biggest challenge business owners face with YouTube isn't creating content. It's finding the time and resources to produce videos consistently while adapting to YouTube's algorithm, which seems to change its mind more often than a toddler choosing breakfast cereal. The unpredictability forces constant strategy shifts, and without understanding your analytics, you're basically throwing darts blindfolded.
So here's what we're doing differently. Instead of explaining what each metric means (boring), we're showing you how to read your YouTube analytics like a treasure map. Where are viewers dropping off? Which traffic sources actually convert? What's your audience retention really telling you about your content structure? And most importantly, what specific changes can you make today that will show results by next week?
Because data without action is just noise. And you've got better things to do than stare at graphs all day.
Ready to turn those intimidating numbers into your unfair competitive advantage? Let's figure this out together.
Beyond the Dashboard: Setting Up Your YouTube Studio for Success
OK, real talk for a second.
Most creators open YouTube Studio for the first time and immediately feel like they've walked into NASA mission control. Buttons everywhere. Tabs that lead to more tabs. Metrics you've never heard of stacked next to percentages that might as well be hieroglyphics.
And here's what happens next. You click around for maybe three minutes, get overwhelmed, and decide you'll "figure it out later." Except later never comes, because who has time to decode a platform that feels designed to confuse you?
But here's the thing nobody wants to admit: the customization features YouTube rolled out in 2024 actually make YouTube Studio way more usable than it used to be. The problem isn't the tool anymore; it's that most of us never learned how to set it up properly in the first place.
So let's fix that right now.
Customizing Your Dashboard (Because Default Settings Are Useless)
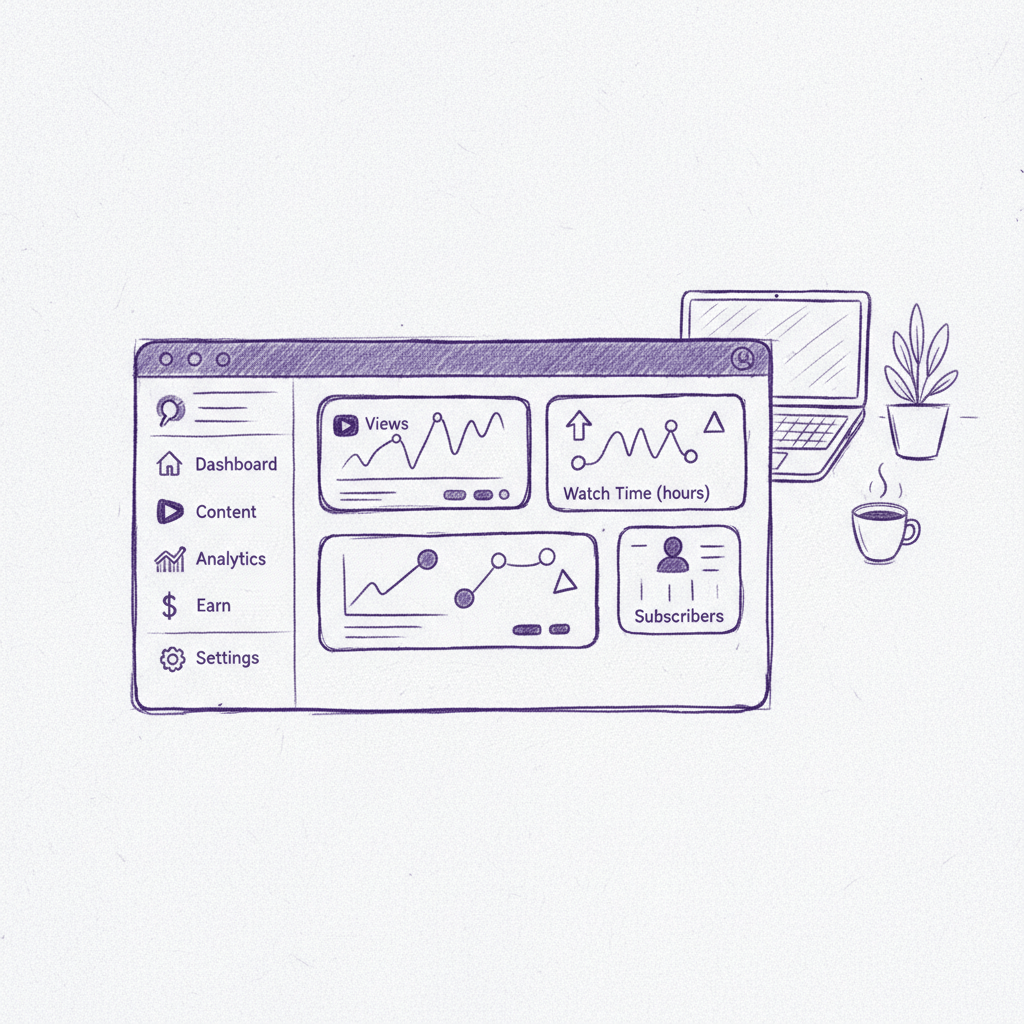
A properly customized YouTube Studio dashboard shows only the metrics that matter for your specific business goals, eliminating the overwhelming clutter of default settings.
The default YouTube Studio dashboard shows you everything. Which sounds great until you realize "everything" includes metrics you don't care about buried next to the two numbers that actually matter for your business.
Here's what you need to do first: customize your dashboard to show only the metrics that drive decisions. For most small business channels, that means prioritizing real-time views, audience retention rates, and click-through rates (CTR) at the top.
Click the three dots in any card on your dashboard. Remove the fluff. Keep what matters.
Why CTR specifically? Because business and educational channels typically see CTRs between 3-7%, and if you're below that range, you've got a thumbnail or title problem that's costing you views every single day. Having that number front and center means you'll actually notice when it drops instead of discovering the issue three weeks later.
Plus, YouTube's enhanced Creator Insights Dashboard now lets you drill down into granular data without leaving the main view. Use it. The algorithm rewards creators who respond quickly to performance changes, and you can't respond to what you're not monitoring.
Understanding the Main Navigation Tabs (Without Reading a Manual)
Four tabs matter most: Content, Analytics, Comments, and Revenue. Let's break down what each one actually does for your business.
Content is your video library and upload hub. Pretty straightforward. But here's what most people miss: you can bulk edit metadata here, which saves hours if you're optimizing older videos for search. Also, the new Inspiration tab curates content ideas and helps refine thumbnails to match your style, which is genuinely useful if you're stuck on what to create next.
Analytics is where the magic happens; this is your strategy goldmine. We're diving deep into these metrics in the next sections, but for now, just know that you should be checking your audience retention report weekly. Not daily. Weekly. Because obsessing over daily fluctuations will drive you nuts without improving results.
Comments seems obvious, but it's actually your fastest route to building community. YouTube's algorithm favors channels with high engagement, and responding to comments consistently signals that you're active and worth promoting. The new AI-enhanced reply suggestions make this less time-consuming, though use them sparingly because nobody wants canned responses.
Revenue shows your monetization data if you're in the Partner Program. If you're not monetized yet, this tab just stares at you judgmentally. Ignore it until you hit the requirements.
Setting Up User Permissions (Because You Can't Do Everything Alone)
Look, if you're running a small business or managing a channel with even one other person, you need to configure user permissions properly. This isn't optional.
For small teams, here's the smart setup: Give your content manager full Manager access so they can handle everything except deleting your channel (which nobody should be able to do except you). If you've got someone helping with video production but not strategy, Editor access gives them upload and editing rights without letting them mess with permissions.
And if you're working with a marketing consultant or agency? Viewer access lets them analyze your data and make recommendations without accidentally publishing something at 2am on a Tuesday.
One critical thing: invited users have 30 days to accept permissions before the invite expires. Follow up if they haven't accepted within a week, because the last thing you need is scrambling to re-send invites when you're trying to launch a campaign.
The real benefit here isn't just access control. It's mental freedom. When you know someone else can handle uploads or monitor comments while you focus on strategy and content creation, you're not stuck doing everything yourself. And for solopreneurs especially, that division of labor (even if it's just between you and a VA) makes the difference between sustainable growth and complete burnout.
Bottom line: YouTube Studio feels complicated because nobody shows you how to configure it for your actual workflow. Spend 15 minutes setting this up correctly now, and you'll save 15 hours over the next month trying to find metrics buried in menus or juggling access requests from team members.
Now that your dashboard is actually useful, let's talk about what those numbers are really telling you.
Decoding the 'Reach' Tab: How Viewers Discover Your Content
Alright, let's talk about the Reach tab.
This is where most creators either feel like marketing geniuses or question every life choice that led them to YouTube. Because the Reach tab doesn't just tell you how many people saw your video; it tells you why they clicked or, more painfully, why they didn't.
And if you're running a business channel trying to turn views into actual customers? Understanding this tab isn't optional. It's the difference between throwing content into the void and strategically positioning yourself in front of people who actually need what you're offering.
Let's break down what's actually happening here.
Impressions vs. Click-Through Rate: The Dance That Makes or Breaks You
Here's how it works. YouTube shows your video thumbnail and title to people (that's an impression). Some of those people click. Some don't. The percentage who click is your CTR.
But here's what most people get wrong about CTR. They obsess over the percentage without looking at where those impressions are coming from. A 2% CTR from Browse Features (YouTube's homepage) is actually solid, because people are casually scrolling, not actively searching. Meanwhile, a 2% CTR from YouTube Search is terrible, because those viewers are specifically looking for content like yours.
Context matters more than the number itself.
Plus, YouTube's algorithm uses CTR as a quality signal. Higher CTR tells the platform, "Hey, people want to watch this." So the algorithm shows your video to more people. Which gives you more impressions. Which, if your CTR holds, gives you more views. It's a flywheel effect that either works for you or against you.
Traffic Sources: Where Your Views Actually Come From
Now let's talk about the three main traffic sources you'll see in YouTube Studio, because each one requires a completely different strategy.
Browse Features (YouTube homepage, subscription feed) is where casual discovery happens. People aren't searching for anything specific; they're just scrolling. Your CTR here will naturally be lower, maybe 2-5%, because you're competing with everything else on their screen. To win here, you need scroll-stopping thumbnails and titles that create curiosity without requiring context.
Suggested Videos appear next to or after other videos. This is YouTube saying, "Based on what you just watched, you might like this." CTR typically runs 7-12% here because the algorithm has already done some matching work. The key to maximizing this source is creating content that naturally fits into popular viewing patterns. If you make videos about email marketing, you want to show up next to other business growth content, not random cat videos.
YouTube Search is high-intent traffic. These viewers typed something specific into the search bar, which means they're actively looking for a solution. For educational and business content, you should be aiming for 10% CTR or higher from search traffic. Lower than that means your title and thumbnail don't match what people expect when they search that term.
The real strategy is understanding which source drives most of your traffic and doubling down on what works. If you're getting tons of search traffic, that means your SEO game is strong; create more content targeting similar keywords. If suggested videos dominate, focus on creating series or related content that keeps viewers in your ecosystem.
Mining the Research Tab for Content Gold
OK so here's where it gets interesting.
Most creators ignore the Research tab (or the search terms data within Traffic Sources), which is basically leaving money on the table. Because this section shows you exactly what people typed into YouTube before finding your video.
Think about that for a second. You're getting a direct feed of the actual problems, questions, and interests your potential audience has. And you're… not using it?
Here's how to actually leverage this data:
First, go to Analytics, then Reach, then Traffic Source: YouTube Search. You'll see a list of search terms that led people to your content. Sort by impressions to see which queries have the most volume. Then look at the CTR for each term.
If a search term has high impressions but low CTR, that's a packaging problem. Your thumbnail or title doesn't match what people expect when they search that phrase. Fix it.
If a search term has high impressions, decent CTR, but you haven't actually made a dedicated video about it? That's your next video idea served on a silver platter. The demand is already proven.
And here's where tools like Taja AI become genuinely useful instead of just another SaaS subscription. Rather than manually researching keywords, analyzing search volume, and guessing at titles, you can let AI analyze your existing performance data and suggest optimized titles, descriptions, and tags based on what's actually working. It's not about replacing strategy; it's about automating the tedious parts so you can focus on creating content that matters.
For example, let's say your analytics show that "how to automate email sequences" is driving decent search traffic but your CTR is only 6%. Taja AI can help you test title variations like "Email Automation in 2025: Set It and Forget It" or "Stop Writing Emails Manually (Here's the 15-Minute Setup)" to see which resonates better. Then it can apply those learnings across your other videos automatically.
The point isn't to hand everything over to robots. It's to use data-driven optimization so you're not guessing every single time you hit publish.
Because look, if you're spending 8 hours creating a video and 8 minutes optimizing how people actually find it, your priorities are backwards. The Reach tab shows you exactly where the bottleneck is. Your job is to fix it before moving on to the next video.
And if your current process involves manually tracking keywords in spreadsheets, copying and pasting titles into five different platforms, and hoping something sticks? You're burning time that could be spent creating better content or, you know, running your actual business.
Bottom line: the Reach tab isn't just analytics porn. It's a roadmap. Follow it.
Mastering 'Engagement': The Secrets to Audience Retention
OK so here's where things get real.
You can have the best thumbnail in the world, drive thousands of impressions, and get people clicking on your video. But if they bounce after 15 seconds? YouTube's algorithm writes you off faster than a bad first date.
Your audience retention graph reveals exactly when and why viewers leave, providing the most actionable insights for improving your content structure and engagement.
The Engagement tab, specifically the audience retention report, is where you see exactly when and why people leave. And trust me, this data hurts. But it's also the most actionable intel you'll ever get about what's actually working in your videos.
Let's break down how to read this thing without spiraling into existential dread.
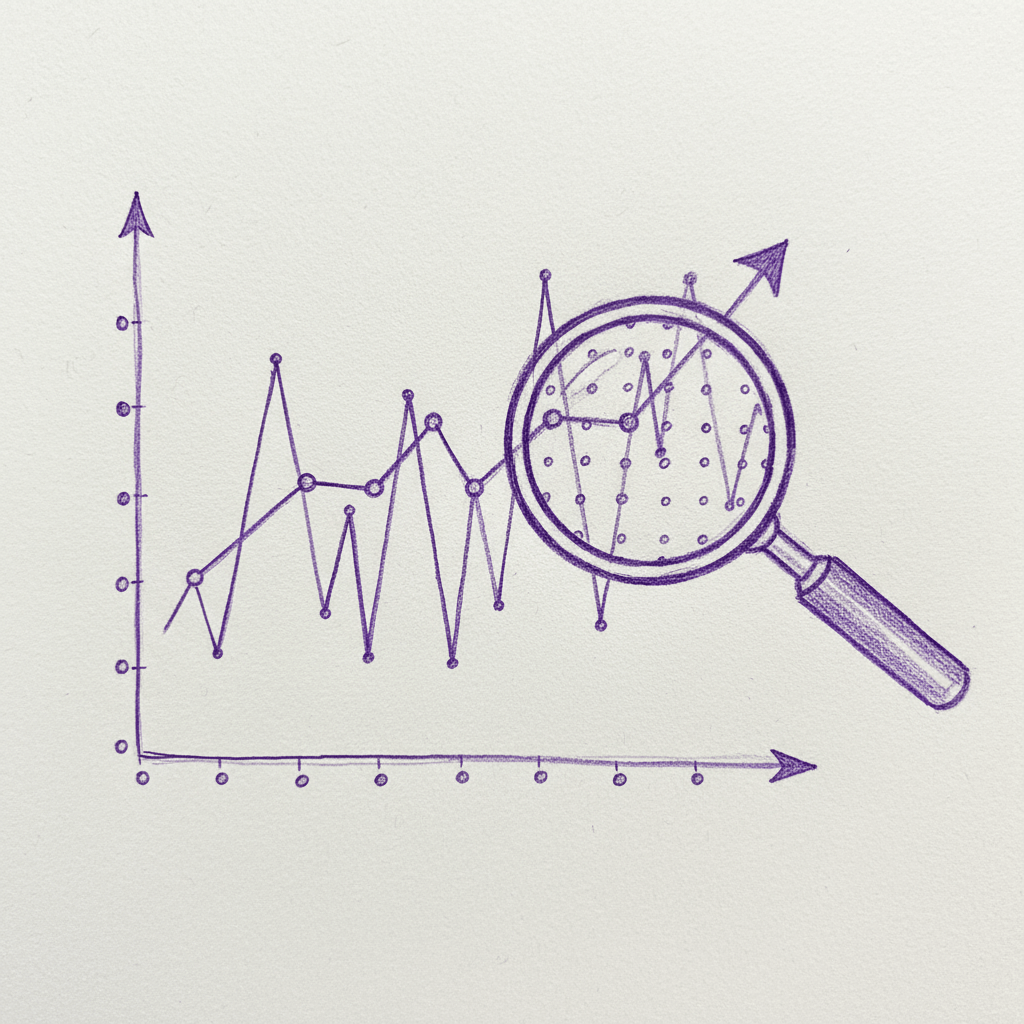
Reading the Audience Retention Graph Like a Detective
When you open your audience retention report, you'll see a graph that looks like a heartbeat monitor at a coffee shop. Peaks, valleys, and one massive drop-off right at the beginning that makes you question your entire content strategy.
The Hook (first 15 seconds): This is make-or-break territory. If you're losing more than 60% of viewers here, your intro isn't clearly communicating value fast enough. Channels that nail this by front-loading their value proposition see an 18% higher retention rate at the 1-minute mark. That's huge.
Sustained Segments (flat or slowly declining lines): These are the golden zones where your content is engaging enough that people stick around. If you've got a 2-minute stretch where retention holds steady, note what you're doing in that section. More of that, please.
Spikes (sudden upward jumps): These happen when viewers rewatch a section or skip forward then come back. Usually indicates you delivered something valuable, funny, or surprising. The Backlinko channel famously analyzed a spike at 1:50 in one of their videos and discovered it corresponded to a detailed example; they started including more examples in future content specifically because of this insight.
Dips (sharp drops): These tell you exactly where you lost people. Maybe your pacing slowed down. Maybe you went off on a tangent. Maybe your B-roll was boring. Whatever it was, the graph doesn't lie.
The 'Key Moments' Report: Your Content Autopsy
YouTube breaks down these patterns further in the 'Key moments for audience retention' section, which categorizes your video into segments. Here's what each one means and what to do about it:
Intro: This covers roughly the first 30 seconds. If this segment shows red (below average retention), your hook needs work. Period. Try these fixes: state your main point in the first 10 seconds, use a cold open that jumps straight into the valuable part before your intro animation, or ask a question that creates a curiosity gap.
Continuous Segments: These are the middle parts of your video where retention stays relatively stable. Green here means you're doing something right. Keep doing it. Yellow or red means people are getting bored; you need pattern interrupts every 60-90 seconds to maintain interest.
Spikes: When you see these, screenshot the timestamp and review what you said or showed at that exact moment. Then reverse-engineer it. If viewers loved your case study at 3:42, structure more of your content around real examples rather than theory.
Dips: This is where you take notes for your next video. Did retention tank when you started explaining a technical concept? Break it down simpler next time. Did people leave during your sponsor segment? Either shorten it or make it more entertaining (sponsor reads don't have to be sleep-inducing).
Three Battle-Tested Strategies to Fix Retention Dips
Alright, diagnosis is done. Now let's talk treatment.
Strategy 1: Pattern Interrupts Every 60-90 Seconds
Your brain is wired to notice change. When a video stays visually or audibly the same for too long, attention wanders. This is why creators like Jenny Hoyos use visual progress indicators, like countdown timers or tally graphics, to give viewers a sense of forward momentum.
For your videos, try this: every 60-90 seconds, introduce a change. Switch camera angles. Cut to B-roll. Show a graphic. Change your background music slightly. Even just standing up or moving to a different spot on screen works. Anything that signals to the viewer's brain, "Hey, something new is happening."
And look, I get it. Shooting multiple angles or gathering B-roll is time-consuming. But you don't need Hollywood-level production. Even cutting to a tight shot of your face for emphasis or showing your screen for 10 seconds counts as a pattern interrupt.
Strategy 2: Improve Your B-Roll Game (Without Spending Hours)
B-roll isn't just filler; it's retention insurance. When you're explaining something abstract, show it visually. When you mention a tool, cut to footage of someone using it. When you reference a statistic, display it on screen.
The mistake most people make is thinking B-roll needs to be custom-shot for every video. It doesn't. Build a library of reusable clips: screen recordings of you navigating YouTube Studio, typing at your computer, scrolling through analytics, generic business shots. Then drop them in whenever your main footage gets stale.
If you're using a tool like Taja AI to repurpose long-form content into Shorts, this same principle applies. The platform auto-selects highlights and adds captions, but you can enhance retention by ensuring those clips have visual variety. A talking head for 60 seconds straight won't hold attention; mix in screen shares, text overlays, or quick cuts between different segments of your original video.
Strategy 3: Re-Script Weaker Sections for Next Time
This one requires ego-checking. When you identify a dip in retention, go back and watch that section of your video. Really watch it. Pretend you're a viewer who doesn't care about your success. Would you keep watching?
Usually, the problem is one of three things: you're explaining something the long way when a simple version would work better, you're including information that doesn't serve your main point, or you're repeating yourself.
Here's the thing about retention that nobody mentions: you can't fix everything in one video. But every video you publish is a test. The retention graph gives you feedback. You adjust. Publish again. Get more feedback. Adjust again.
And if you're doing this manually for every upload while also trying to run a business? That's where automation helps. Taja AI analyzes your retention patterns across uploads and suggests optimizations for titles, descriptions, and even chapter markers based on where viewers engage most. It's not about letting AI create your content; it's about letting it handle the tedious optimization work so you can focus on the creative fixes that actually move retention numbers.
So stop ignoring those dips. Start treating your retention graph like the roadmap it is.
Knowing Your 'Audience': Who Is Watching and What Do They Want?
Alright, here's something nobody talks about enough.
You can obsess over CTR and retention all day long, but if you don't actually know who's watching your videos? You're basically shouting into a void and hoping the right people happen to walk by.
The Audience tab in YouTube Studio is where the magic of real connection happens. This is where you figure out if you're attracting the people you actually want to serve, or if your content is accidentally pulling in an audience that'll never convert into customers.
Let's dig into what these numbers are really telling you.
Demographics: Beyond the Surface Numbers
When you click into the Audience tab and see age, gender, and geography breakdowns, your first instinct might be to just glance and move on. Big mistake.
These demographics are your channel's reality check. If you're creating content for small business owners but 70% of your audience is 18-24 year olds, something's off. Either your messaging doesn't match your target market, or your packaging (thumbnails and titles) is attracting the wrong crowd.
Here's how to actually use this data:
Age breakdown tells you whether your content complexity matches your viewer maturity. If you're targeting experienced marketers but pulling mostly younger viewers, your content might be too basic or your delivery too casual. Flip side? If you want a younger audience but you're getting mostly 45-65 year olds, your pacing might be too slow or your references too outdated.
Gender split matters more than you'd think, especially for business channels. If you're teaching a skill that should appeal universally but seeing an 80/20 split either direction, examine your examples and case studies. Are you unconsciously using language or scenarios that skew heavily toward one group?
Geography shows you where to focus localization efforts. If 40% of your views come from India but all your pricing examples use USD and American references, you're missing opportunities. Consider creating supplementary content or at least acknowledging international viewers in your scripts.
And here's the kicker about subscriber bell notifications. YouTube now shows you what percentage of your subscribers have notifications turned on. For business channels aiming for 50-70% returning viewers, this metric directly impacts whether those returning viewers actually show up when you publish.
Low notification rates (under 10%)? Your community isn't engaged enough to want real-time updates. Fix this by creating more valuable, consistent content and explicitly asking viewers to hit the bell during your outros.
Mining 'Other Videos Your Audience Watches' for Strategic Gold
OK so this section is where most creators just look for content ideas. That's fine. But you're leaving money on the table if that's all you do.
The 'Other videos your audience watches' report shows you the channels and specific videos your viewers consume when they're not watching you. This is pure competitive intelligence, and it tells you three critical things:
First, your actual niche. Not the niche you think you're in, but the one YouTube has categorized you in based on viewer behavior. If you make email marketing content but your viewers are also watching videos about TikTok growth and Instagram strategy, congratulations; you're in the broader 'digital marketing' category, not the 'email marketing' niche. Adjust your content strategy accordingly.
Second, collaboration opportunities. Those channels your audience watches? Those are your ideal collaboration partners. Not the huge names with millions of subscribers (though if they show up, cool). The channels with 10K-100K subscribers that share your audience. Reach out. Propose a collab. Their audience already likes content similar to yours, which means they're pre-qualified to become your viewers too.
Third, content gaps. Look at what those other channels are covering that you're not. Not to copy them, but to identify topics your audience clearly cares about that you haven't addressed. If three of the top channels your viewers watch have videos about LinkedIn lead generation and you've never covered it, that's a content opportunity screaming at you.
And if you're wondering how to track all this without spending 3 hours in spreadsheets? This is exactly where Taja AI's analytics integration becomes useful. Rather than manually noting which channels appear, comparing them against your content calendar, and trying to identify patterns, you can let AI surface those insights automatically. It's not about replacing your strategic thinking; it's about not wasting time on data collection when you could be creating content or reaching out to potential collaborators.
The Returning vs. New Viewer Metric: Your Community Health Score
Here's the metric that separates channels building businesses from channels just accumulating views.
Why does this matter so much? Because new viewers are just traffic. Returning viewers are your community. They're the ones who'll buy your products, hire your services, and recommend you to others.
If your channel shows below 30% returning viewers, you've got a loyalty problem. You're attracting clicks but not building relationships. Here's how to fix it:
Create series instead of one-offs. When you publish Part 1 of a series, viewers have a reason to come back for Parts 2 and 3. This literally trains them to check your channel regularly. Plus, YouTube's algorithm loves series because they keep viewers in your ecosystem longer.
Use community posts weekly. Between uploads, post behind-the-scenes updates, polls, or quick tips. This keeps your channel top-of-mind even when you're not publishing full videos. The more touchpoints you create, the more likely viewers become regulars.
End every video with a specific next-step recommendation. Don't just say "check out my other videos." Say "If you liked this breakdown of email automation, watch this video next where I show you the exact sequence I use." Make the path to becoming a returning viewer completely frictionless.
Engage in comments within the first hour. When viewers comment and you respond quickly, they get a notification. That notification brings them back to your video. More importantly, it signals that you're accessible and care about your community, which builds the kind of loyalty that converts casual viewers into regulars.
And look, if you're publishing long-form content and manually creating follow-up Shorts to drive viewers back to your main channel, you're doing it the hard way. Taja AI can automatically generate Shorts from your long-form videos, complete with captions and optimized for each platform (YouTube Shorts, TikTok, Instagram Reels). Those Shorts become touchpoints that remind viewers you exist between main uploads, directly boosting your returning viewer percentage without requiring hours of manual editing.
The bottom line here is simple: the Audience tab isn't just analytics. It's your roadmap to building a channel that actually serves your business goals instead of just racking up vanity metrics.
Know who's watching. Understand what else they care about. Give them reasons to come back. That's how you turn YouTube analytics into actual revenue.
Unlocking 'Advanced Mode' for Deeper Content & Shorts Insights
OK so you've mastered the basics. You know what CTR means, you've stopped freaking out about retention dips, and you can actually interpret your audience demographics without needing a PhD in data science.
But here's where most creators plateau.
They stick with the default Analytics view, clicking around the same four tabs, never realizing that YouTube Studio has an entire layer of advanced functionality hiding in plain sight. And for business channels trying to scale efficiently? That's leaving serious optimization potential on the table.
Enter Advanced Mode.
This isn't some secret setting buried in developer tools. It's a comparison feature built directly into YouTube Studio that lets you analyze multiple videos side-by-side, dig into Shorts-specific metrics that don't show up in standard reports, and understand traffic patterns in ways the basic dashboard simply can't reveal.
Let's break down how to actually use this thing.
Step 1: Accessing Advanced Comparisons
First, navigate to Analytics, then click on the "Advanced mode" toggle in the top-right corner. Boom. Your interface just got a whole lot more powerful.
Now you can compare up to 25 videos simultaneously across any metric YouTube tracks. Want to see which of your last 10 videos had the best CTR? Done. Need to identify which topics drive the most subscriber growth? Two clicks.
Here's what most people miss: don't just compare random videos. Compare videos within the same content category or topic cluster. If you make marketing tutorials, compare all your email marketing videos against each other to see which approach (case study vs. tutorial vs. tool review) performs best. That's actionable intelligence, not just interesting data.
For metrics, focus on these three for business channels:
Click-through rate (CTR): Tells you which topics and packaging combinations actually get people to click. If Video A has 8% CTR and Video B has 3% on the same topic, your packaging on Video A is objectively better.
Average view duration (AVD): Shows which content keeps people watching longest. This directly impacts how aggressively YouTube promotes your videos. A 10-minute video with 7-minute AVD will outperform a 15-minute video with 4-minute AVD every single time.
Subscribers gained: The ultimate business metric. Which videos turn casual viewers into people who want more of your content? Double down on those topics and formats.
Alright, here's something nobody warned you about. Shorts analytics work fundamentally differently from long-form video metrics, and if you're trying to analyze them the same way, you're going to make terrible decisions.
When you click on a Short in your Analytics tab, you'll see three metrics that don't exist for regular videos:
"Viewed vs. Swiped Away" is your primary success indicator. This shows the percentage of viewers who watched your Short all the way through versus those who swiped to the next video. For Shorts under 30 seconds, you want close to 100% viewed. Over 30 seconds? Aim for at least 75-80%.
Why does this matter so much? Because unlike long-form content where a 50% retention rate might be acceptable, Shorts compete in a swipe-heavy environment where viewers grant you maybe 3 seconds to prove you're worth watching. If people are consistently swiping away at the 5-second mark, your hook isn't strong enough.
"Shown in Feed" tells you how many times YouTube displayed your Short in the Shorts Feed versus other traffic sources like your channel page or external sites. You want 80%+ of your traffic coming from the Shorts Feed, because that's where the algorithm is actively recommending you. Low feed placement means YouTube tested your Short and decided it wasn't engaging enough to push widely.
One creator I know had a Short with 50K views but only 20% from the Shorts Feed. Turns out, they'd shared it across their email list and social media, which inflated the view count but signaled to YouTube that organic discovery was weak. Their next Short, optimized for feed performance, hit 200K views with 85% from feed traffic.
"Average Percentage Viewed" shows exactly what portion of your Short viewers watched on average. This is similar to retention for long-form content but operates on a much stricter scale. Anything below 60% average percentage viewed suggests your content has a major mid-video problem, either pacing, value delivery, or visual interest.
Here's the thing about Shorts that drives most business creators nuts: the metrics are unforgiving. A 2-second hook that doesn't immediately communicate value costs you 40% of your potential views. A boring middle section at 15 seconds? People swipe. Your call-to-action takes 5 seconds to deliver? Nobody sees it because they already left.
Step 3: Understanding Shorts Feed Traffic (Your Real Growth Engine)
Now let's talk about traffic sources for Shorts, because this is where the strategy gets interesting.
Click into any Short's analytics, then navigate to "Traffic source: Shorts Feed." This shows you exactly how people found your Short within YouTube's vertical feed. And unlike long-form videos where you've got browse, search, and suggested as your main sources, Shorts live or die by feed performance.
The Shorts Feed operates on what I call the "3-Second Rule." Viewers scrolling through hundreds of Shorts per session give each video roughly 3 seconds to grab attention before swiping. That's it. Three seconds.
So what actually hooks people in that timeframe?
Movement. Static shots underperform dramatically. If your first frame looks like a frozen image, swipe rate goes through the roof. Start with action: someone gesturing, text appearing, a visual transition, anything that signals "this is video, not a photo."
Text overlays. Probably 70% of Shorts Feed viewers scroll with sound off. If your hook relies entirely on audio, you're losing the majority of potential viewers immediately. Put your value proposition in text within the first second.
Pattern interrupts. The Shorts Feed is visually chaotic; hundreds of videos competing for attention. Your Short needs to look different enough to break the scroll pattern. Unusual camera angles, high-contrast colors, unexpected compositions, anything that makes the brain go "wait, what's that?"
And here's where tools like Taja AI become genuinely useful for Shorts strategy. Rather than manually creating dozens of variations to test hooks, the platform can analyze your long-form content, automatically extract the most engaging moments (based on retention spikes), and generate Short-form versions optimized for each platform's specific requirements.
For example, let's say you've got a 15-minute tutorial that shows a retention spike at the 8:32 mark where you demonstrate a specific technique. Taja AI identifies that spike, creates a 30-second Short around that moment, adds optimized captions for sound-off viewing, and formats it for both YouTube Shorts and TikTok specs. Then it can publish directly to both platforms from one interface, saving you the manual export, re-upload, and optimization process.
The real value isn't just time savings, though that's significant. It's using your existing retention data to inform which moments actually deserve to become Shorts, rather than guessing or manually scrubbing through hours of footage hoping to find gold.
Making Shorts Work for Business Goals
Here's what most business channels get wrong about Shorts. They treat them as mini-commercials for their long-form content or products. "Watch this 60-second teaser, then click through to my main video!"
That approach fails because it misunderstands viewer intent. People scrolling the Shorts Feed aren't looking for teasers; they want complete, self-contained value delivered fast. Your Short needs to deliver its entire promise within its runtime, not serve as a trailer.
Instead, use Shorts to demonstrate expertise and build authority in bite-sized chunks. One actionable tip. One quick answer. One perspective shift. Complete the loop.
Then, if viewers want more depth, they'll naturally click through to your channel or long-form content. But the Short itself must stand alone as valuable content, not a half-finished pitch.
And about those traffic source metrics? Monitor them weekly, not daily. The Shorts algorithm tests content over 48-72 hours before deciding whether to push it widely. A Short that looks like it's flopping at 24 hours might explode at 72 hours when the algorithm decides to promote it. Checking every 6 hours just stresses you out without providing useful data.
Bottom line: Advanced Mode and Shorts analytics aren't just nerdy data deep-dives. They're the difference between guessing what content works and knowing exactly which formats, topics, and approaches drive the business outcomes you actually care about. Use them.
From Insights to Action: Building Your Data-Driven Workflow
OK so here's the truth bomb nobody wants to hear.
You can know every single metric in YouTube Studio by heart. CTR, AVD, retention spikes, traffic sources, all of it. But if you're not translating that knowledge into consistent action? You're just collecting data for fun.
So let's build a workflow that actually works for real humans with real time constraints. Not some fantasy where you've got 6 hours a day to analyze graphs.
Your Weekly Analytics Review (15 Minutes, Maximum)
Here's the system I use, and it takes less time than scrolling TikTok during lunch.
Every Monday at 10am (pick your own time, but make it consistent), open YouTube Studio and check exactly three things:
1. Last Week's Top Performer (3 minutes): Which video got the most views or highest CTR? Click into its analytics. Screenshot the retention graph. Note the traffic source that drove the most views. This video is your template; it's telling you exactly what's working right now.
2. Search Terms Report (5 minutes): Go to Reach, then Traffic Source: YouTube Search. Sort by impressions. Look for any search term with high impressions but CTR below 7%. That's low-hanging fruit. Your content matches what people want, but your packaging doesn't. Add those exact search phrases to your running list of "titles to optimize."
3. Retention Dips on Recent Uploads (7 minutes): Check your last three videos. Any section where retention drops more than 20% suddenly? Note the timestamp and what you were doing at that moment. That's your "don't do this again" list.
That's it. Fifteen minutes. You're done.
The monthly version adds one extra step: compare this month's returning viewer percentage to last month. Growing? Keep doing what you're doing. Shrinking? Time to revisit your series strategy or community engagement.
Connecting Analytics to Taja AI Optimization
Now here's where the workflow gets interesting.
Remember those search terms you noted from the Reach tab? The ones with high impressions but weak CTR? Instead of manually brainstorming 47 different title variations and hoping one works, feed that data directly into Taja AI.
For example, let's say your analytics show "how to grow email list" has 12,000 impressions but only 4% CTR. You know people are searching for it. They're seeing your video. They're just not clicking.
Plug that search term into Taja AI's optimization tool. It'll analyze current top performers for that phrase, identify what makes those titles and thumbnails work, and suggest variations optimized for 2025 viewer behavior. Maybe it recommends "Grow Your Email List to 10K in 90 Days (Without Paid Ads)" instead of your current "Email List Growth Tips." More specific. More compelling. Better match to search intent.
The beauty here is you're not guessing. You're using your actual performance data (from YouTube Studio) to inform AI-driven optimization (through Taja AI). Data drives decisions drives results.
And the same logic applies to descriptions and tags. Your Research tab shows you exactly what language your audience uses when searching. Taja AI makes sure that language appears in your metadata in ways that actually help SEO, not just keyword stuffing that reads like a robot wrote it.
Turning Retention Spikes Into High-Engagement Shorts
Here's something most creators miss completely.
Those retention spikes on your Audience Retention graph? The moments where viewers rewatch or jump back to a specific timestamp? That's pure gold for Shorts creation.
Let's say you've got a 12-minute tutorial on setting up email automation. Your retention graph shows a massive spike at 7:23, right when you demonstrate a specific technique. That spike tells you viewers found that moment incredibly valuable. They rewatched it. Some probably shared that exact timestamp with colleagues.
That's your Short.
Manually, you'd need to: scrub through the video to find that moment, export that section, crop it for vertical format, add captions (because 70% of Shorts viewers watch with sound off), optimize the title and description for each platform's algorithm, and upload separately to YouTube Shorts, TikTok, Instagram Reels, and Facebook.
That's easily 45 minutes of work. Per Short.
Or you let Taja AI handle it. Upload your long-form video. The platform automatically identifies retention spikes using YouTube's API data. It extracts those high-engagement moments, crops them to vertical format, adds captions optimized for sound-off viewing, and generates platform-specific metadata. Then it publishes to all four platforms from one interface.
You just turned 45 minutes into 5 minutes.
And because you're using actual retention data to select clips rather than randomly choosing moments that "feel" good, your Shorts perform better. Higher average percentage viewed. Lower swipe-away rates. More feed placement from YouTube's algorithm.
One creator I know used this exact workflow to grow from 800 subscribers to 4,200 in three months, purely through Shorts driving traffic back to their main channel. They weren't making more content; they were making smarter content based on what their analytics already proved worked.
The Ultimate Time-Saving Strategy
Look, if you're a solopreneur or running a small team, time is your most valuable asset. Not money. Not equipment. Time.
You make one long-form video. That's your core content creation time. Let's say 6 hours from scripting to shooting to editing.
Then instead of spending another 3 hours manually optimizing metadata, creating Shorts, and scheduling across platforms, you let Taja AI compress that into 20 minutes. The AI handles title optimization based on your search term data. It creates Shorts from your retention spikes. It publishes everything on your schedule.
You just saved 2 hours and 40 minutes per video.
Post weekly? That's nearly 11 hours saved per month. That's time you can spend creating better content, reaching out to collaboration partners, or actually taking a day off without your channel dying.
And the best part? The optimization gets better over time. As Taja AI learns from your performance data, it refines its suggestions. The titles it recommends become more aligned with what actually drives clicks for your specific audience. The Shorts it creates match the pacing and style that your viewers respond to.
You're not just saving time. You're building a smarter system that compounds results while you sleep.
Bottom line: YouTube Studio analytics only matter if you act on them. And the only sustainable way to act on them consistently is by automating the tedious parts so you can focus on the creative decisions that actually move the needle.
Data without action is noise. Action without systems is chaos. Systems that learn and improve? That's how you turn YouTube analytics into actual business growth.
Now stop reading. Go check your analytics. Pick one thing to optimize this week. Then let the tools handle the rest.
Your Data is Your Roadmap: Drive Your Channel Forward
Here's the thing about YouTube Studio that most people don't want to admit.
It's not a report card. It's not a scoreboard. And it's definitely not some complicated puzzle designed to make you feel inadequate every time you log in.
YouTube Studio is a GPS for your channel. It shows you exactly where you are, where you're going, and which routes are getting you there faster. The numbers don't judge you; they guide you. And once you stop treating analytics like a test you're failing and start treating them like the strategic intelligence they actually are, everything changes.
With your niche validated and content strategy mapped out, you're ready to start creating with confidence instead of guesswork.
Look, we started this guide by acknowledging a brutal truth: 63% of creators are burned out, partly because they're drowning in data they don't know how to use. That's not your fault. Nobody teaches this stuff. But now you know better.
You've learned how to customize your dashboard so it actually shows what matters. You understand that CTR isn't just a percentage, it's feedback on whether your packaging matches viewer intent. You can read retention graphs like a detective finding clues about what works and what doesn't. You know that returning viewers are worth more than new ones for building a business. And you've seen how Advanced Mode and Shorts analytics unlock insights that basic dashboards hide.
But here's where most guides end and leave you hanging: knowing what the numbers mean is useless if you don't act on them.
Only 12% of marketers use AI to analyze their performance data, which means 88% are either ignoring analytics entirely or spending hours manually trying to make sense of it all. Neither approach scales. And if you're running a business, you can't afford either one.
This is why combining human insight with AI automation isn't optional in 2025. It's survival.
You bring the strategic thinking. What topics resonate with your audience? What problems are you solving? What makes your perspective unique? Those are human decisions that no algorithm can make for you.
But the tedious optimization work? Title testing, metadata optimization, identifying which 30-second clip from your 15-minute video deserves to become a Short, scheduling content across four platforms while maintaining consistent branding? That's where tools like Taja AI step in and handle the grunt work so you can focus on creating content that actually matters.
Because look, the alternative is burning out. You can't manually optimize every upload, create Shorts from scratch, research keywords for every title, and publish to multiple platforms without eventually hitting a wall. The biggest challenge business owners face isn't creating content; it's finding the time and resources to keep up. Automation solves that.
Your retention graph tells you which moments viewers loved. Taja AI turns those moments into Shorts automatically. Your search terms report shows what people want. Taja AI optimizes your titles and descriptions to match that demand. Your analytics reveal patterns across uploads. Taja AI learns from those patterns and applies insights to future content.
You stay creative. The AI stays efficient. Together, you build a channel that grows while you sleep.
So here's your homework for this week, and it's simpler than you think.
Pick one metric from this guide. Just one.
Maybe it's CTR. Check your Reach tab, find a video with high impressions but low CTR, and test a new thumbnail or title. See if the number moves.
Maybe it's audience retention. Pull up your last video, identify the biggest dip, and figure out what you'll do differently next time. Then actually do it.
Maybe it's a traffic source. If YouTube Search is sending you traffic, double down on keyword-optimized content. If Suggested Videos dominate, create more series-style content that keeps viewers in your ecosystem.
One metric. One change. One week.
Then check back next Monday and see what happened. Not to judge yourself, but to learn. Because that's what this whole process is about: learning what works, doing more of it, and letting the data guide your decisions instead of your gut.
YouTube Studio isn't scary once you know how to read it. And once you start acting on what it tells you? Your channel becomes a machine that generates reach, builds authority, and drives actual business outcomes.
The data's already there. The roadmap's already drawn. Now you just need to follow it.
Go check your analytics. Pick your metric. Make your change.

.jpeg)